Visualization
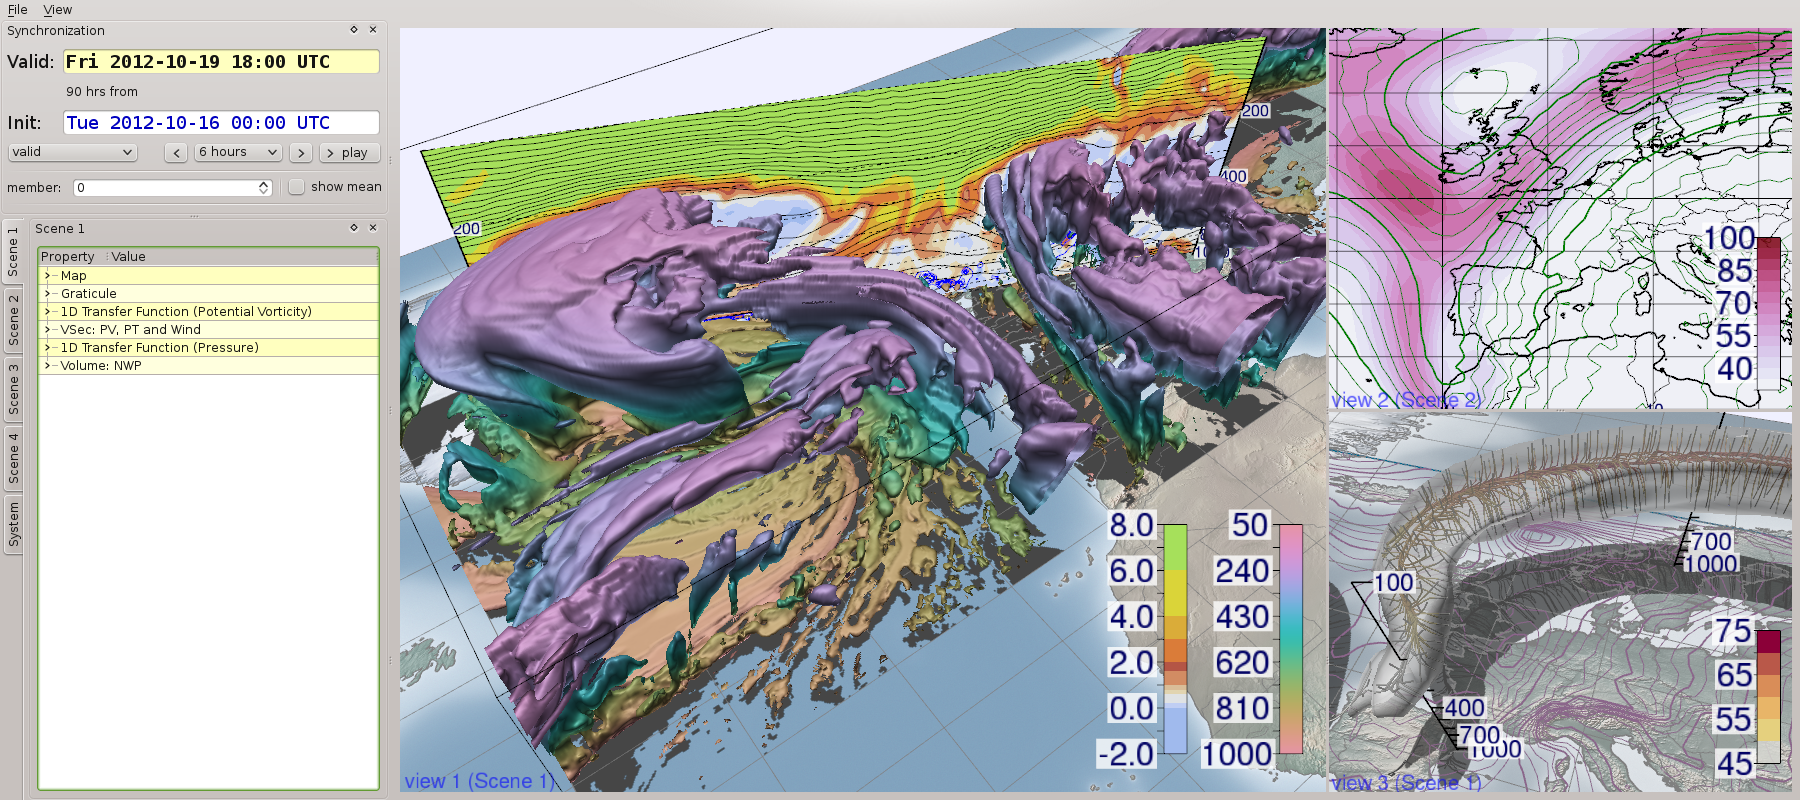
 The main user interface of Met.3D. We apply 2-D and 3-D visualization techniques to explore ensemble weather forecasts. Middle panel: isosurfaces of cloud cover fraction of 0.5 coloured by elevation (hPa), and a vertical section of potential vorticity (PVU). Upper right panel: horizontal section with contour lines of the mean geopotential height field (m) and filled contours of its standard deviation (m). Lower right panel: normal curves applied to the wind field to visualize the jet core. The white isosurface shows 45 m/s. Colour coding in m/s. Image: Marc Rautenhaus.
Visual data analysis was established as a central field of research in W2W because many of the research topics in W2W require a statistical or feature-based analysis of time-varying 3D ensemble fields. The CCA Visualization promotes an early use of newly developed visualization techniques in meteorological research and serves as a platform for interdisciplinary exchange between W2W researchers.
The following activities within the CCA are planned:
- Facilitating access to visualization tools and communication between visualization researchers and meteorologists
- Contributing to a computational infrastructure to enable interactive ensemble processing and visualization
- Organizing yearly workshops on visualization methods and research
- Coordinating common case studies, allowing the visualization researchers to test their methods in real-case scenarios and the W2W researchers to test the effectiveness of the developed tools.
Project A7 provides a focal point for the CCA Visualization. The CCA is led by Rüdiger Westermann in close collaboration with Marc Rautenhaus, Elmar Schömer and Filip Sadlo.
For more information on the activities organized by the CCA Visualization, click here.
For more information about Met.3D, click here.


